Canadian Retail Sales Growth Headed for 10 Year Low
/photo: Njene/shutterstock
By Ed Strapagiel
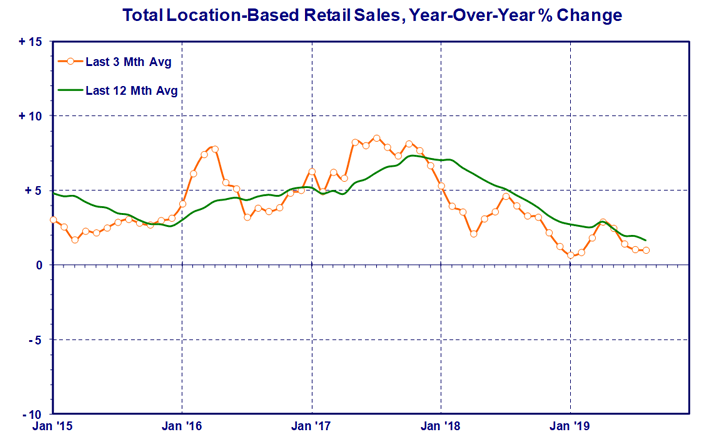
The latest numbers from Statistics Canada show that Canadian retail sales growth continues to weaken. For the 3 months ending August 2019, retail sales gained a mere 1.0% year-over-year on a not seasonally adjusted basis. After 8 months of 2019, or 2/3 of the year, year-to-date Canadian retail sales are up only 1.8% compared to a year ago.
Current trends imply things are going to get worse before they get better. The 3 month sales growth trend (orange line in the chart above) continues to decline, while the underlying 12 month trend (green line) is at another new low. At current rates, retail sales growth in 2019 could end up at around 1.3% or 1.4%, which would make it the worst year since 2009 and the so-called Great Recession.
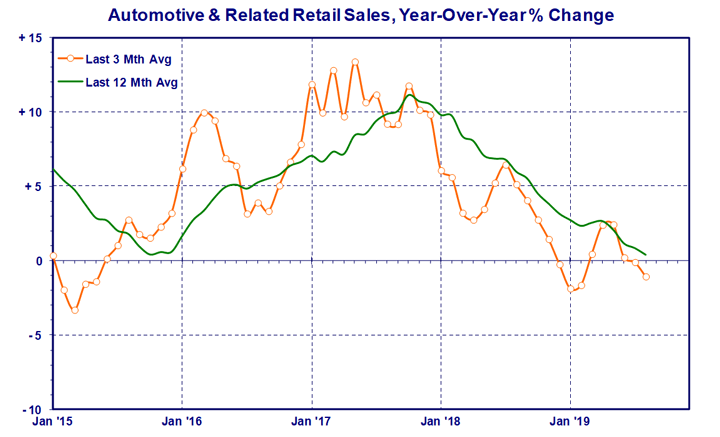
Most of the bad news however is coming from the Automotive & Related sector, due to declining gasoline station sales combined with very modest growth at new car dealers. The Food & Drug sector has also gone into a funk in the last several months. By comparison, the Store Merchandise sector is not doing too badly and is managing to keep its head above water.
Food & Drug
The Food & Drug sector's retail sales growth was actually leading the market for most of the first half of 2019. That has now evaporated, with sales up only 1.2% for the 3 months ending August. This has now replaced July as the second worst such gain in the last 6 years.
The above chart shows how much the 3 month trend (orange line) has weakened recently. The underlying 12 month trend (green line) seems to be holding its ground but is unlikely to continue to do so. Under current circumstances, the Food & Drug sector stands to end up with a even lower retail sales in 2019 than last year's weak showing.
Grocery stores are not doing well, with retail sales up a scant 0.2% year-over-year for the 3 months ending August 2019. Convenience stores' performance was particularly weak, down 6.7% in the period.
photo: loblaw
Health and personal care stores did somewhat better, gaining 2.4% in retail sales for the 3 months ending August 2019. Their year-to-date retail sales are up 2.6% after 8 months, which puts health and personal care stores on track to record slightly higher growth in 2019 than a year ago.
Store Merchandise
Store Merchandise retail sales gained 3.3% year-over-year for the 3 months ending August 2019. This was actually the highest such result so far in 2019, and a significantly better performance than the other major retail sectors.
The 3 month trend (orange line in the chart) is improving slightly compared to the start of the year. As a result, the underlying 12 month trend (green line) has flattened out and no longer appears to be declining. Year-to-date retail sales in Store Merchandise are up 2.5%, but current trends imply this could improve somewhat by year's end.
photo: mqn architects
As usual, there were big discrepancies in how well various store types performed. Miscellaneous store retailers led the pack with a year-over-year gain of 11.8% in the last 3 months, thanks to the addition of cannabis stores (the effect of which will decline at the start of next year). General Merchandise stores also had a healthy retail sales increase of 5.2% for the period.
On the other hand, electronics and appliance stores continue to be the doormat of retail, and their retail sales were down 10.2% year-over-year for the 3 months ending August 2019. Shoe stores and sporting goods, hobby, book & music stores also had slightly lower sales.
Note that Statistics Canada is now suppressing the breakdown of general merchandise stores for confidentiality reasons. The figures in the "By The Numbers" table below are estimates based on previous trends.
Automotive & Related
Things in the Automotive & Related sector got uglier in the latest StatsCan data. Retail sales were down 1.1% year-over-year for the 3 months ending August 2019. Year-to-date sales are up only 0.4% after 8 months, but only thanks to a brief uptick in the second quarter. The underlying 12 month trend (green line in the chart) is on a nose dive and could very well end up in negative territory for 2019 overall.
photo: shutterstock
Slow retail sales at gas stations are the main problem. Their sales declined 5.2% in the 3 months ending August, and are off 4.7% on a year-to-date basis. This is because of depressed gasoline prices, but it is not apparent that consumers are using their savings to spend in other areas of retail.
In the past, automobile dealer sales tended to offset poor performance at gasoline stations, but this no longer appears to be the case. Retail sales at new car dealers were up just 0.4% year-over-year for the 3 months ending August 2019.
By The Numbers
Special Note: Statistics Canada revised historical data with the February 2019 release. Unadjusted monthly data were revised back to January 2018, while seasonally adjusted data were revised back to January 2015. Those keeping score should update their files. The analysis in this report is always based on unadjusted data.
Canadian E-Commerce Sales
StatsCan started providing ecommerce retail sales data in January 2016. While the amount of data is limited, some trends appear to be emerging. Here are some results.
Overall, e-commerce represented about 3.3% of total Canadian retail sales for the 12 months ending August 2019, including both pure play operators as well as the online operations of brick & mortar stores. Canadian consumers however also buy online from foreign websites which is not captured in these numbers.
Canadian e-commerce sales were up 29.9% year-over-year for the 3 months ending August 2019. This was much higher than for location based retail which gained just 1.0%.
Note that location based retail is the same as that in the preceding "By The Numbers" table. It's what's normally reported as Canadian retail sales. Except that it isn't. Location based retail excludes another section called Non-Store Retailers (NAICS code 454), which includes electronic shopping and mail-order houses, which in turn is where (mostly) pure play e-commerce businesses are. For the 12 months ending August 2019, electronic shopping and mail-order houses had an estimated $12.8 billion in e-commerce sales.
But that's not the only source of e-commerce, as (mostly) bricks & mortar location-based retailers also sell online. For the 12 months ending August 2019, this group had an estimated $7.8 billion in e-commerce sales. With electronic shopping and mail-order houses, there's a grand total of $20.6 billion in e-commerce sales by Canadian operators over the year. Note that this does not include foreign e-commerce purchases made by Canadian consumers, but it does include e-commerce purchases made by foreigners at Canadian operations.
For electronic shopping and mail-order houses, an estimated 85.5% of their sales are allocated to e-commerce. For (mostly) bricks & mortar retailers, it can be estimated that just 1.3% of their total sales are attributable to e-commerce.
In the final section of the above table, (mostly) pure play operators (namely, under electronic shopping and mail-order houses) generated an estimated 62.1% of all e-commerce sales in Canada, while (mostly) bricks & mortar location-based retailers' share of e-commerce is 37.9%.
For more explanation on the e-commerce numbers, see Statistics Canada: Retail E-commerce in Canada.
This analysis is updated monthly as new numbers are published by Statistics Canada. If you would like notification of when an update becomes available (and you've read this far), please connect with Ed Strapagiel on LinkedIn.


![Retail-insider-NRIG-banner-300-x-300-V01-3[2].jpg](https://images.squarespace-cdn.com/content/v1/529fc0c0e4b088b079c3fb6d/1593476525034-QRWBY8JUPUYFUKJD2X9Z/Retail-insider-NRIG-banner-300-x-300-V01-3%5B2%5D.jpg)
![Retail-insider-NRIG-banner-300-x-300-V01-2[2].jpg](https://images.squarespace-cdn.com/content/v1/529fc0c0e4b088b079c3fb6d/1593476491497-W6OZKVGCJATXESC9EZ0O/Retail-insider-NRIG-banner-300-x-300-V01-2%5B2%5D.jpg)
![Retail-insider-NRIG-banner-300-x-300-V01-4[2].jpg](https://images.squarespace-cdn.com/content/v1/529fc0c0e4b088b079c3fb6d/1593476508900-TJG5SNQ294YNOCK6X8OW/Retail-insider-NRIG-banner-300-x-300-V01-4%5B2%5D.jpg)